| 0 | 1 | 2 | 3 | 4 | 5 | 6 | 7 | 8 | |
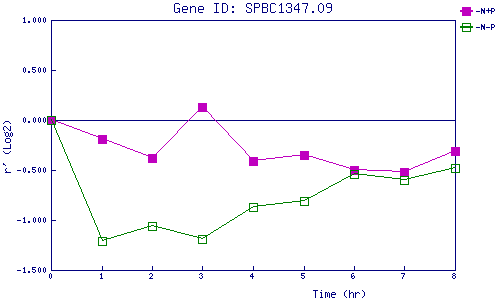
| -N+P | 0.000 | -0.190 | -0.378 | 0.128 | -0.413 | -0.346 | -0.497 | -0.519 | -0.308 |
| -N-P | 0.000 | -1.210 | -1.060 | -1.189 | -0.871 | -0.811 | -0.536 | -0.596 | -0.475 |
|
-N+P: Nitrogen starved in the presence of P-factor -N-P: Nitrogen starved in the absence of P-factor |