cdc23 mcm10
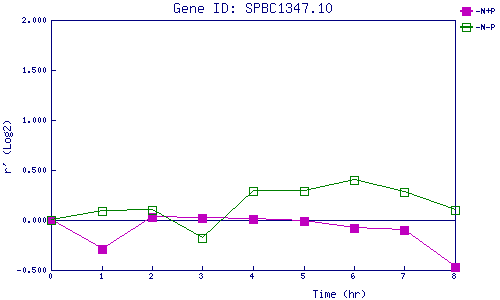
| 0 | 1 | 2 | 3 | 4 | 5 | 6 | 7 | 8 | |
| -N+P | 0.000 | -0.290 | 0.032 | 0.018 | 0.006 | -0.011 | -0.079 | -0.100 | -0.471 |
| -N-P | 0.000 | 0.091 | 0.097 | -0.182 | 0.286 | 0.290 | 0.404 | 0.284 | 0.103 |
|
-N+P: Nitrogen starved in the presence of P-factor -N-P: Nitrogen starved in the absence of P-factor |