| 0 | 1 | 2 | 3 | 4 | 5 | 6 | 7 | 8 | |
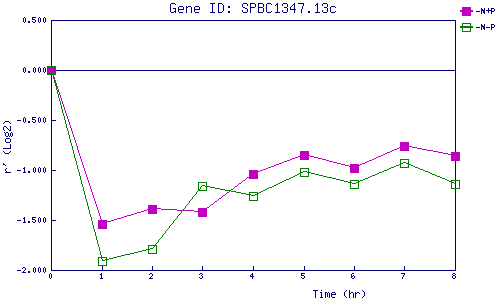
| -N+P | 0.000 | -1.538 | -1.393 | -1.419 | -1.045 | -0.849 | -0.978 | -0.765 | -0.859 |
| -N-P | 0.000 | -1.912 | -1.787 | -1.157 | -1.256 | -1.021 | -1.144 | -0.930 | -1.138 |
|
-N+P: Nitrogen starved in the presence of P-factor -N-P: Nitrogen starved in the absence of P-factor |