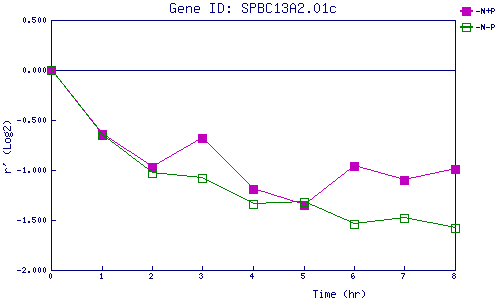
| 0 | 1 | 2 | 3 | 4 | 5 | 6 | 7 | 8 | |
| -N+P | 0.000 | -0.636 | -0.968 | -0.685 | -1.187 | -1.348 | -0.961 | -1.096 | -0.988 |
| -N-P | 0.000 | -0.652 | -1.027 | -1.077 | -1.343 | -1.318 | -1.536 | -1.481 | -1.585 |
|
-N+P: Nitrogen starved in the presence of P-factor -N-P: Nitrogen starved in the absence of P-factor |