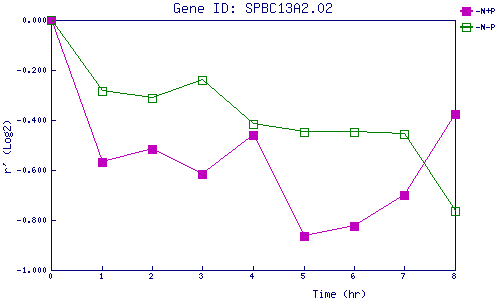
| 0 | 1 | 2 | 3 | 4 | 5 | 6 | 7 | 8 | |
| -N+P | 0.000 | -0.570 | -0.517 | -0.617 | -0.460 | -0.862 | -0.825 | -0.699 | -0.377 |
| -N-P | 0.000 | -0.283 | -0.310 | -0.240 | -0.415 | -0.447 | -0.447 | -0.456 | -0.765 |
|
-N+P: Nitrogen starved in the presence of P-factor -N-P: Nitrogen starved in the absence of P-factor |