| 0 | 1 | 2 | 3 | 4 | 5 | 6 | 7 | 8 | |
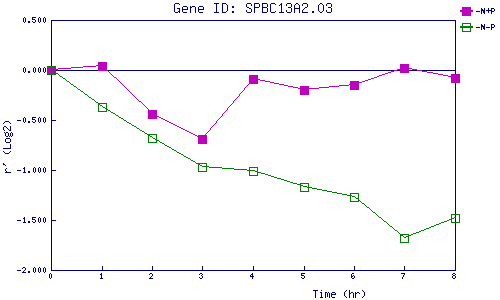
| -N+P | 0.000 | 0.038 | -0.444 | -0.690 | -0.090 | -0.196 | -0.152 | 0.025 | -0.085 |
| -N-P | 0.000 | -0.371 | -0.685 | -0.969 | -1.008 | -1.174 | -1.274 | -1.683 | -1.484 |
|
-N+P: Nitrogen starved in the presence of P-factor -N-P: Nitrogen starved in the absence of P-factor |