ptr2
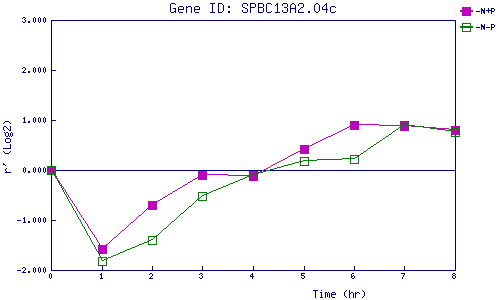
| 0 | 1 | 2 | 3 | 4 | 5 | 6 | 7 | 8 | |
| -N+P | 0.000 | -1.579 | -0.698 | -0.100 | -0.113 | 0.422 | 0.902 | 0.871 | 0.799 |
| -N-P | 0.000 | -1.825 | -1.394 | -0.511 | -0.104 | 0.175 | 0.216 | 0.891 | 0.761 |
|
-N+P: Nitrogen starved in the presence of P-factor -N-P: Nitrogen starved in the absence of P-factor |