cwf22
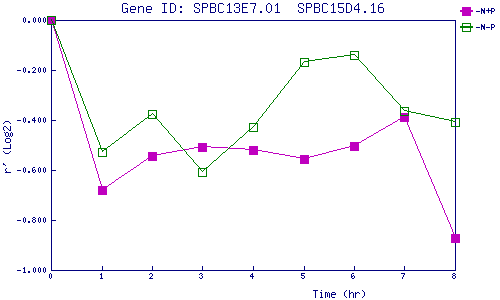
| 0 | 1 | 2 | 3 | 4 | 5 | 6 | 7 | 8 | |
| -N+P | 0.000 | -0.682 | -0.545 | -0.507 | -0.519 | -0.556 | -0.506 | -0.389 | -0.874 |
| -N-P | 0.000 | -0.530 | -0.376 | -0.607 | -0.427 | -0.168 | -0.141 | -0.365 | -0.410 |
|
-N+P: Nitrogen starved in the presence of P-factor -N-P: Nitrogen starved in the absence of P-factor |