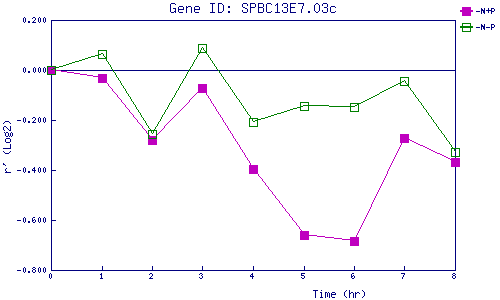
| 0 | 1 | 2 | 3 | 4 | 5 | 6 | 7 | 8 | |
| -N+P | 0.000 | -0.031 | -0.280 | -0.070 | -0.395 | -0.659 | -0.685 | -0.271 | -0.366 |
| -N-P | 0.000 | 0.065 | -0.256 | 0.087 | -0.208 | -0.146 | -0.148 | -0.043 | -0.326 |
|
-N+P: Nitrogen starved in the presence of P-factor -N-P: Nitrogen starved in the absence of P-factor |