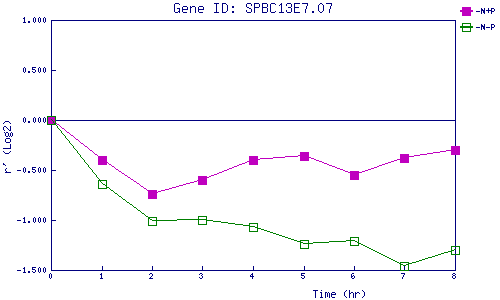
| 0 | 1 | 2 | 3 | 4 | 5 | 6 | 7 | 8 | |
| -N+P | 0.000 | -0.402 | -0.738 | -0.598 | -0.398 | -0.355 | -0.554 | -0.377 | -0.298 |
| -N-P | 0.000 | -0.642 | -1.010 | -0.998 | -1.071 | -1.236 | -1.212 | -1.458 | -1.297 |
|
-N+P: Nitrogen starved in the presence of P-factor -N-P: Nitrogen starved in the absence of P-factor |