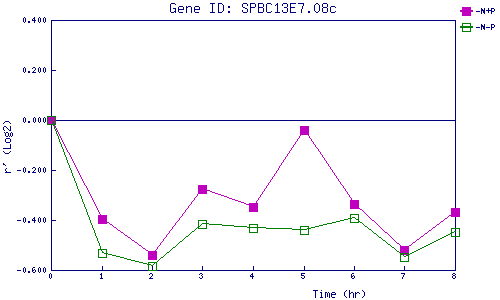
| 0 | 1 | 2 | 3 | 4 | 5 | 6 | 7 | 8 | |
| -N+P | 0.000 | -0.397 | -0.541 | -0.275 | -0.348 | -0.042 | -0.338 | -0.521 | -0.366 |
| -N-P | 0.000 | -0.532 | -0.586 | -0.417 | -0.433 | -0.442 | -0.394 | -0.547 | -0.448 |
|
-N+P: Nitrogen starved in the presence of P-factor -N-P: Nitrogen starved in the absence of P-factor |