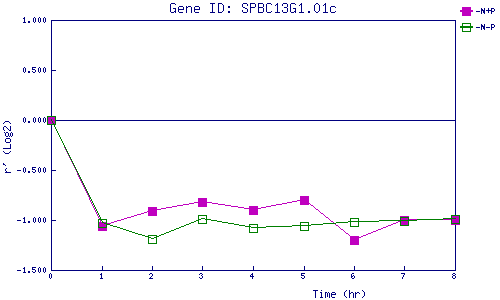
| 0 | 1 | 2 | 3 | 4 | 5 | 6 | 7 | 8 | |
| -N+P | 0.000 | -1.057 | -0.909 | -0.816 | -0.897 | -0.796 | -1.205 | -1.001 | -1.000 |
| -N-P | 0.000 | -1.026 | -1.193 | -0.986 | -1.083 | -1.062 | -1.021 | -1.009 | -0.992 |
|
-N+P: Nitrogen starved in the presence of P-factor -N-P: Nitrogen starved in the absence of P-factor |