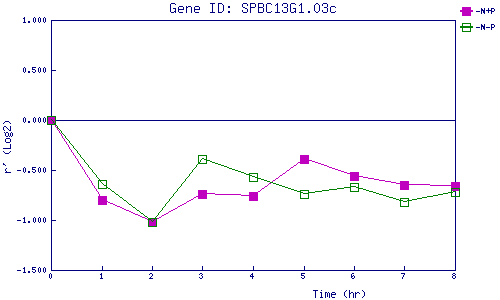
| 0 | 1 | 2 | 3 | 4 | 5 | 6 | 7 | 8 | |
| -N+P | 0.000 | -0.800 | -1.023 | -0.745 | -0.764 | -0.391 | -0.555 | -0.646 | -0.662 |
| -N-P | 0.000 | -0.642 | -1.019 | -0.386 | -0.573 | -0.743 | -0.666 | -0.816 | -0.716 |
|
-N+P: Nitrogen starved in the presence of P-factor -N-P: Nitrogen starved in the absence of P-factor |