| 0 | 1 | 2 | 3 | 4 | 5 | 6 | 7 | 8 | |
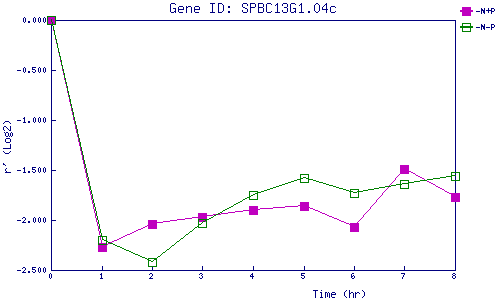
| -N+P | 0.000 | -2.274 | -2.035 | -1.971 | -1.902 | -1.865 | -2.070 | -1.491 | -1.766 |
| -N-P | 0.000 | -2.205 | -2.418 | -2.032 | -1.751 | -1.586 | -1.727 | -1.644 | -1.564 |
|
-N+P: Nitrogen starved in the presence of P-factor -N-P: Nitrogen starved in the absence of P-factor |