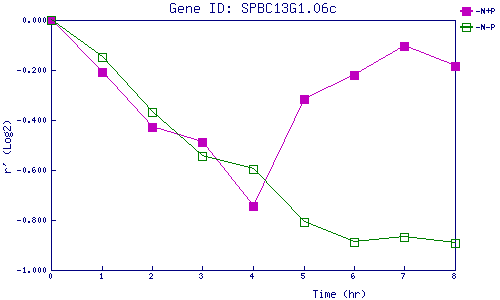
| 0 | 1 | 2 | 3 | 4 | 5 | 6 | 7 | 8 | |
| -N+P | 0.000 | -0.209 | -0.428 | -0.487 | -0.745 | -0.316 | -0.221 | -0.104 | -0.183 |
| -N-P | 0.000 | -0.147 | -0.370 | -0.543 | -0.596 | -0.810 | -0.886 | -0.869 | -0.891 |
|
-N+P: Nitrogen starved in the presence of P-factor -N-P: Nitrogen starved in the absence of P-factor |