| 0 | 1 | 2 | 3 | 4 | 5 | 6 | 7 | 8 | |
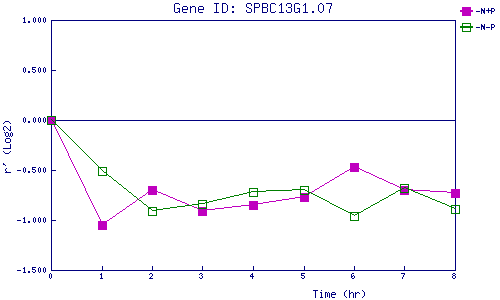
| -N+P | 0.000 | -1.049 | -0.697 | -0.914 | -0.852 | -0.772 | -0.472 | -0.704 | -0.729 |
| -N-P | 0.000 | -0.507 | -0.910 | -0.838 | -0.715 | -0.703 | -0.956 | -0.678 | -0.889 |
|
-N+P: Nitrogen starved in the presence of P-factor -N-P: Nitrogen starved in the absence of P-factor |
