ash2
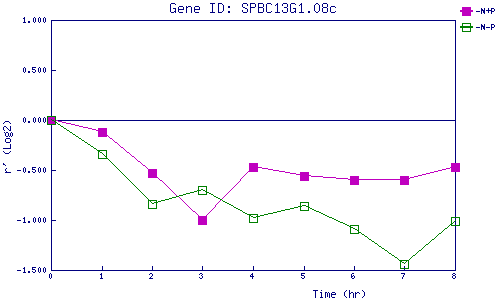
| 0 | 1 | 2 | 3 | 4 | 5 | 6 | 7 | 8 | |
| -N+P | 0.000 | -0.116 | -0.526 | -0.998 | -0.467 | -0.565 | -0.599 | -0.604 | -0.471 |
| -N-P | 0.000 | -0.336 | -0.844 | -0.699 | -0.981 | -0.862 | -1.092 | -1.444 | -1.009 |
|
-N+P: Nitrogen starved in the presence of P-factor -N-P: Nitrogen starved in the absence of P-factor |