| 0 | 1 | 2 | 3 | 4 | 5 | 6 | 7 | 8 | |
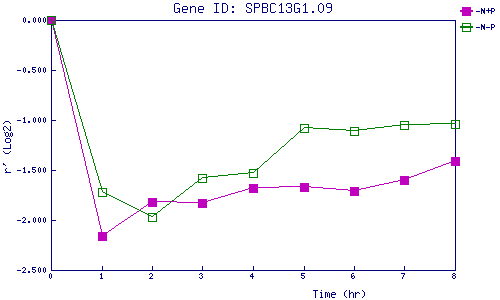
| -N+P | 0.000 | -2.157 | -1.822 | -1.833 | -1.676 | -1.672 | -1.709 | -1.596 | -1.409 |
| -N-P | 0.000 | -1.716 | -1.970 | -1.579 | -1.526 | -1.083 | -1.111 | -1.050 | -1.040 |
|
-N+P: Nitrogen starved in the presence of P-factor -N-P: Nitrogen starved in the absence of P-factor |