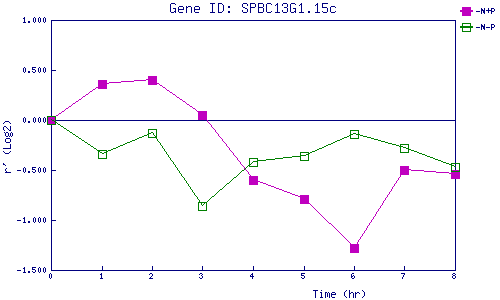
| 0 | 1 | 2 | 3 | 4 | 5 | 6 | 7 | 8 | |
| -N+P | 0.000 | 0.359 | 0.405 | 0.047 | -0.599 | -0.791 | -1.278 | -0.497 | -0.542 |
| -N-P | 0.000 | -0.343 | -0.126 | -0.856 | -0.424 | -0.356 | -0.138 | -0.285 | -0.468 |
|
-N+P: Nitrogen starved in the presence of P-factor -N-P: Nitrogen starved in the absence of P-factor |