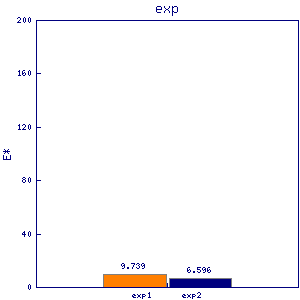
cut3
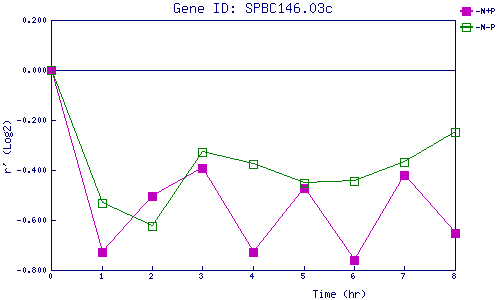
| 0 | 1 | 2 | 3 | 4 | 5 | 6 | 7 | 8 | |
| -N+P | 0.000 | -0.730 | -0.502 | -0.394 | -0.727 | -0.472 | -0.761 | -0.420 | -0.651 |
| -N-P | 0.000 | -0.531 | -0.623 | -0.328 | -0.378 | -0.453 | -0.443 | -0.370 | -0.249 |
|
-N+P: Nitrogen starved in the presence of P-factor -N-P: Nitrogen starved in the absence of P-factor |