cwf25
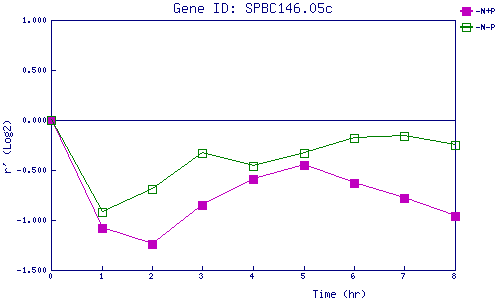
| 0 | 1 | 2 | 3 | 4 | 5 | 6 | 7 | 8 | |
| -N+P | 0.000 | -1.080 | -1.244 | -0.849 | -0.590 | -0.450 | -0.632 | -0.782 | -0.955 |
| -N-P | 0.000 | -0.923 | -0.686 | -0.328 | -0.458 | -0.333 | -0.183 | -0.157 | -0.246 |
|
-N+P: Nitrogen starved in the presence of P-factor -N-P: Nitrogen starved in the absence of P-factor |