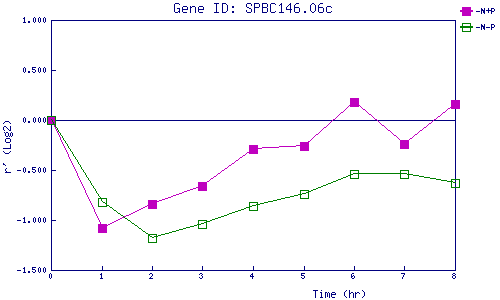
| 0 | 1 | 2 | 3 | 4 | 5 | 6 | 7 | 8 | |
| -N+P | 0.000 | -1.076 | -0.842 | -0.660 | -0.292 | -0.259 | 0.181 | -0.242 | 0.159 |
| -N-P | 0.000 | -0.818 | -1.180 | -1.039 | -0.857 | -0.737 | -0.544 | -0.542 | -0.633 |
|
-N+P: Nitrogen starved in the presence of P-factor -N-P: Nitrogen starved in the absence of P-factor |