prp2 mis11
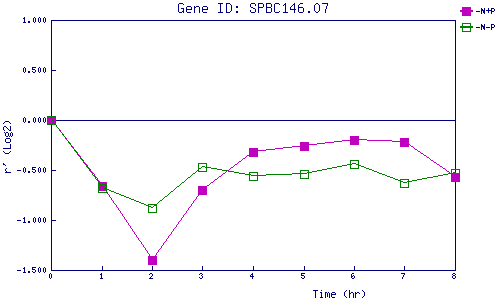
| 0 | 1 | 2 | 3 | 4 | 5 | 6 | 7 | 8 | |
| -N+P | 0.000 | -0.660 | -1.402 | -0.704 | -0.323 | -0.256 | -0.199 | -0.224 | -0.572 |
| -N-P | 0.000 | -0.680 | -0.882 | -0.467 | -0.562 | -0.543 | -0.438 | -0.633 | -0.534 |
|
-N+P: Nitrogen starved in the presence of P-factor -N-P: Nitrogen starved in the absence of P-factor |