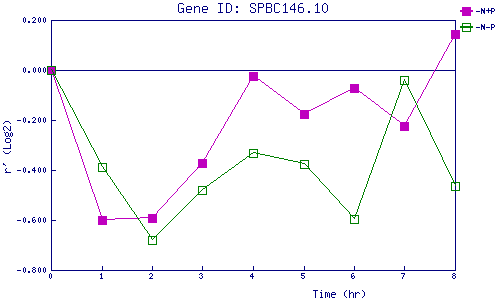
| 0 | 1 | 2 | 3 | 4 | 5 | 6 | 7 | 8 | |
| -N+P | 0.000 | -0.600 | -0.593 | -0.373 | -0.023 | -0.176 | -0.073 | -0.224 | 0.142 |
| -N-P | 0.000 | -0.387 | -0.679 | -0.478 | -0.332 | -0.377 | -0.595 | -0.041 | -0.463 |
|
-N+P: Nitrogen starved in the presence of P-factor -N-P: Nitrogen starved in the absence of P-factor |