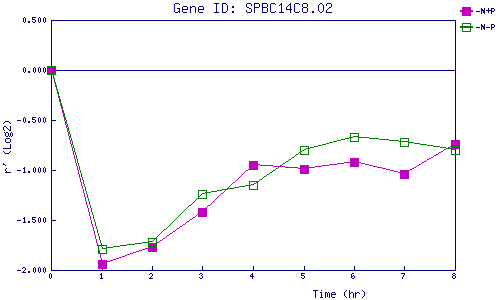
| 0 | 1 | 2 | 3 | 4 | 5 | 6 | 7 | 8 | |
| -N+P | 0.000 | -1.943 | -1.772 | -1.425 | -0.947 | -0.993 | -0.921 | -1.042 | -0.744 |
| -N-P | 0.000 | -1.792 | -1.725 | -1.243 | -1.153 | -0.798 | -0.674 | -0.723 | -0.801 |
|
-N+P: Nitrogen starved in the presence of P-factor -N-P: Nitrogen starved in the absence of P-factor |