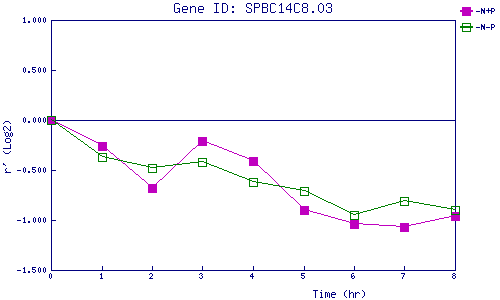
| 0 | 1 | 2 | 3 | 4 | 5 | 6 | 7 | 8 | |
| -N+P | 0.000 | -0.260 | -0.685 | -0.208 | -0.411 | -0.904 | -1.040 | -1.066 | -0.958 |
| -N-P | 0.000 | -0.366 | -0.476 | -0.415 | -0.625 | -0.708 | -0.947 | -0.812 | -0.903 |
|
-N+P: Nitrogen starved in the presence of P-factor -N-P: Nitrogen starved in the absence of P-factor |