| 0 | 1 | 2 | 3 | 4 | 5 | 6 | 7 | 8 | |
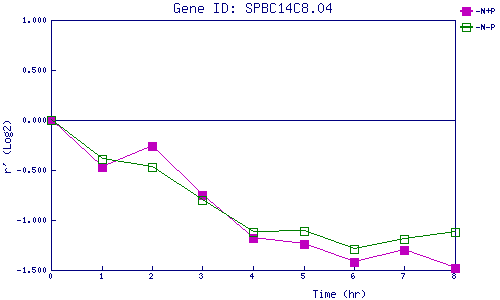
| -N+P | 0.000 | -0.468 | -0.258 | -0.747 | -1.175 | -1.245 | -1.417 | -1.298 | -1.480 |
| -N-P | 0.000 | -0.391 | -0.467 | -0.795 | -1.116 | -1.109 | -1.290 | -1.188 | -1.120 |
|
-N+P: Nitrogen starved in the presence of P-factor -N-P: Nitrogen starved in the absence of P-factor |