meu17
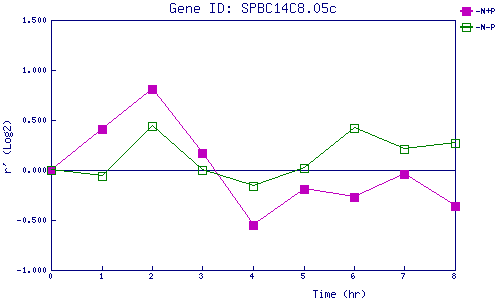
| 0 | 1 | 2 | 3 | 4 | 5 | 6 | 7 | 8 | |
| -N+P | 0.000 | 0.413 | 0.814 | 0.169 | -0.550 | -0.186 | -0.271 | -0.039 | -0.360 |
| -N-P | 0.000 | -0.059 | 0.441 | 0.001 | -0.160 | 0.024 | 0.417 | 0.214 | 0.268 |
|
-N+P: Nitrogen starved in the presence of P-factor -N-P: Nitrogen starved in the absence of P-factor |