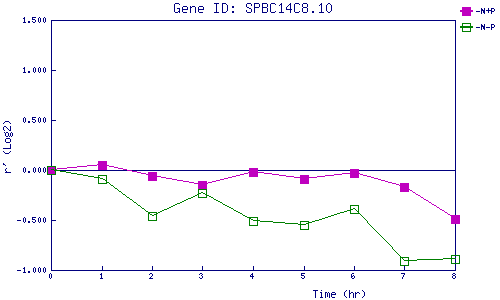
| 0 | 1 | 2 | 3 | 4 | 5 | 6 | 7 | 8 | |
| -N+P | 0.000 | 0.049 | -0.064 | -0.148 | -0.018 | -0.090 | -0.026 | -0.171 | -0.489 |
| -N-P | 0.000 | -0.089 | -0.457 | -0.229 | -0.509 | -0.553 | -0.389 | -0.909 | -0.890 |
|
-N+P: Nitrogen starved in the presence of P-factor -N-P: Nitrogen starved in the absence of P-factor |