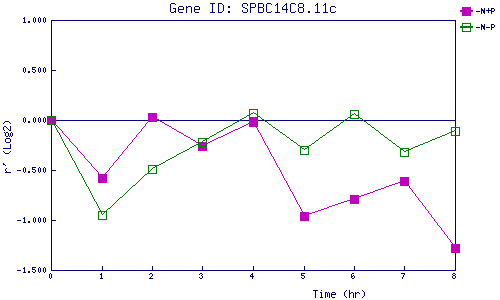
| 0 | 1 | 2 | 3 | 4 | 5 | 6 | 7 | 8 | |
| -N+P | 0.000 | -0.580 | 0.034 | -0.261 | -0.025 | -0.965 | -0.788 | -0.606 | -1.278 |
| -N-P | 0.000 | -0.954 | -0.489 | -0.215 | 0.068 | -0.301 | 0.060 | -0.322 | -0.107 |
|
-N+P: Nitrogen starved in the presence of P-factor -N-P: Nitrogen starved in the absence of P-factor |