rpb8
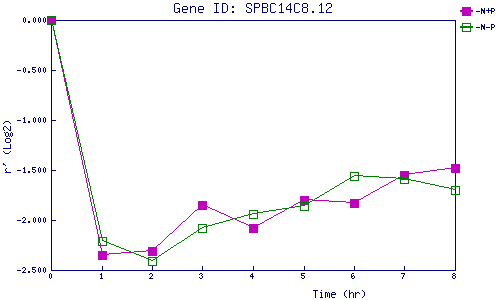
| 0 | 1 | 2 | 3 | 4 | 5 | 6 | 7 | 8 | |
| -N+P | 0.000 | -2.352 | -2.312 | -1.847 | -2.076 | -1.799 | -1.828 | -1.547 | -1.482 |
| -N-P | 0.000 | -2.214 | -2.413 | -2.085 | -1.939 | -1.861 | -1.555 | -1.592 | -1.704 |
|
-N+P: Nitrogen starved in the presence of P-factor -N-P: Nitrogen starved in the absence of P-factor |