| 0 | 1 | 2 | 3 | 4 | 5 | 6 | 7 | 8 | |
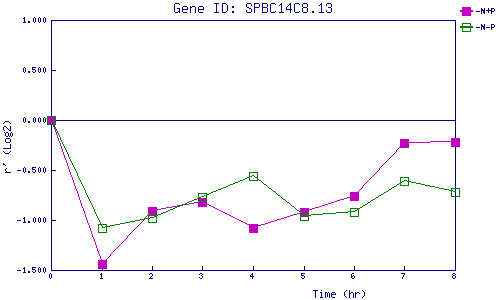
| -N+P | 0.000 | -1.444 | -0.908 | -0.815 | -1.079 | -0.917 | -0.760 | -0.230 | -0.217 |
| -N-P | 0.000 | -1.080 | -0.983 | -0.767 | -0.560 | -0.963 | -0.924 | -0.607 | -0.722 |
|
-N+P: Nitrogen starved in the presence of P-factor -N-P: Nitrogen starved in the absence of P-factor |