pol5
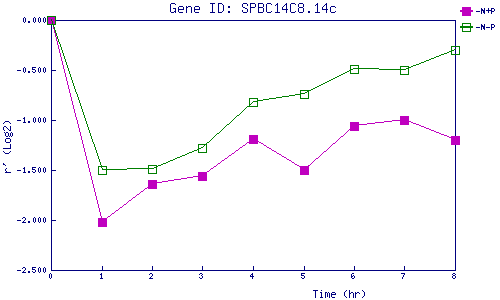
| 0 | 1 | 2 | 3 | 4 | 5 | 6 | 7 | 8 | |
| -N+P | 0.000 | -2.023 | -1.639 | -1.557 | -1.191 | -1.497 | -1.060 | -0.996 | -1.197 |
| -N-P | 0.000 | -1.503 | -1.488 | -1.282 | -0.821 | -0.737 | -0.494 | -0.502 | -0.302 |
|
-N+P: Nitrogen starved in the presence of P-factor -N-P: Nitrogen starved in the absence of P-factor |