| 0 | 1 | 2 | 3 | 4 | 5 | 6 | 7 | 8 | |
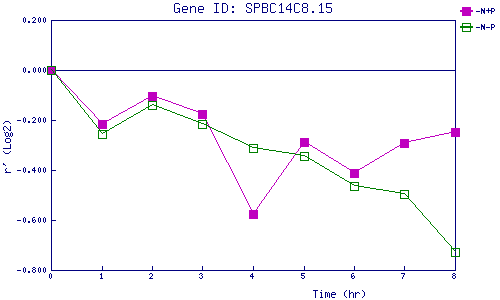
| -N+P | 0.000 | -0.214 | -0.102 | -0.178 | -0.578 | -0.287 | -0.412 | -0.291 | -0.247 |
| -N-P | 0.000 | -0.254 | -0.140 | -0.215 | -0.310 | -0.343 | -0.465 | -0.498 | -0.730 |
|
-N+P: Nitrogen starved in the presence of P-factor -N-P: Nitrogen starved in the absence of P-factor |