bot1
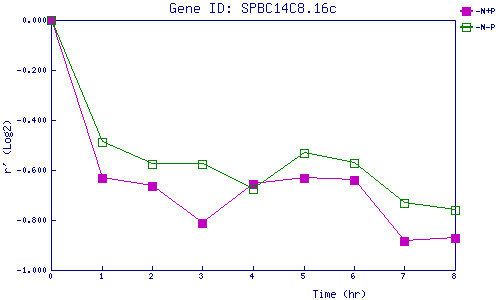
| 0 | 1 | 2 | 3 | 4 | 5 | 6 | 7 | 8 | |
| -N+P | 0.000 | -0.630 | -0.666 | -0.812 | -0.655 | -0.630 | -0.642 | -0.885 | -0.871 |
| -N-P | 0.000 | -0.490 | -0.574 | -0.576 | -0.676 | -0.532 | -0.572 | -0.733 | -0.758 |
|
-N+P: Nitrogen starved in the presence of P-factor -N-P: Nitrogen starved in the absence of P-factor |