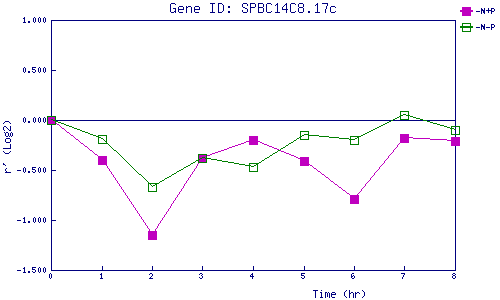
| 0 | 1 | 2 | 3 | 4 | 5 | 6 | 7 | 8 | |
| -N+P | 0.000 | -0.404 | -1.146 | -0.379 | -0.199 | -0.412 | -0.787 | -0.185 | -0.213 |
| -N-P | 0.000 | -0.188 | -0.673 | -0.383 | -0.468 | -0.149 | -0.200 | 0.051 | -0.097 |
|
-N+P: Nitrogen starved in the presence of P-factor -N-P: Nitrogen starved in the absence of P-factor |