kap123
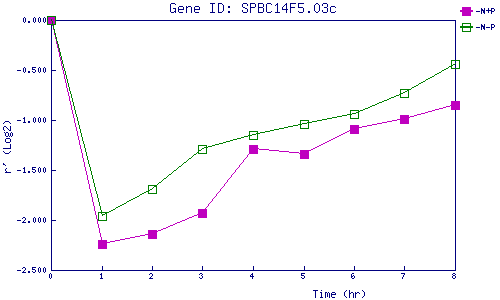
| 0 | 1 | 2 | 3 | 4 | 5 | 6 | 7 | 8 | |
| -N+P | 0.000 | -2.239 | -2.135 | -1.928 | -1.286 | -1.343 | -1.088 | -0.989 | -0.848 |
| -N-P | 0.000 | -1.958 | -1.688 | -1.287 | -1.148 | -1.040 | -0.940 | -0.733 | -0.445 |
|
-N+P: Nitrogen starved in the presence of P-factor -N-P: Nitrogen starved in the absence of P-factor |