pgk1
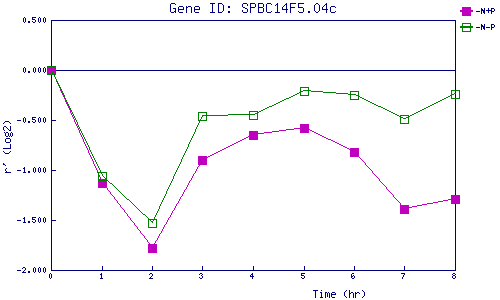
| 0 | 1 | 2 | 3 | 4 | 5 | 6 | 7 | 8 | |
| -N+P | 0.000 | -1.129 | -1.776 | -0.895 | -0.654 | -0.582 | -0.817 | -1.391 | -1.293 |
| -N-P | 0.000 | -1.055 | -1.527 | -0.455 | -0.447 | -0.207 | -0.247 | -0.490 | -0.244 |
|
-N+P: Nitrogen starved in the presence of P-factor -N-P: Nitrogen starved in the absence of P-factor |