| 0 | 1 | 2 | 3 | 4 | 5 | 6 | 7 | 8 | |
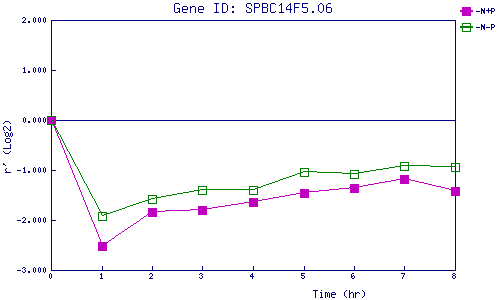
| -N+P | 0.000 | -2.530 | -1.842 | -1.797 | -1.631 | -1.451 | -1.364 | -1.188 | -1.412 |
| -N-P | 0.000 | -1.927 | -1.578 | -1.398 | -1.401 | -1.049 | -1.078 | -0.921 | -0.941 |
|
-N+P: Nitrogen starved in the presence of P-factor -N-P: Nitrogen starved in the absence of P-factor |