med7
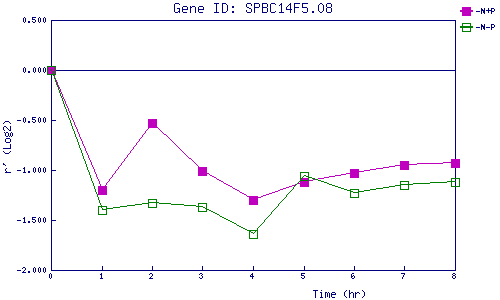
| 0 | 1 | 2 | 3 | 4 | 5 | 6 | 7 | 8 | |
| -N+P | 0.000 | -1.197 | -0.526 | -1.011 | -1.297 | -1.119 | -1.027 | -0.953 | -0.929 |
| -N-P | 0.000 | -1.399 | -1.329 | -1.370 | -1.636 | -1.059 | -1.229 | -1.148 | -1.124 |
|
-N+P: Nitrogen starved in the presence of P-factor -N-P: Nitrogen starved in the absence of P-factor |