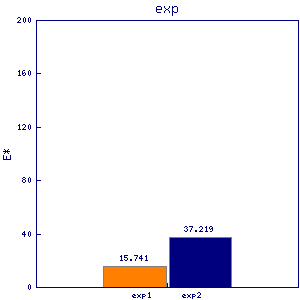
ade8
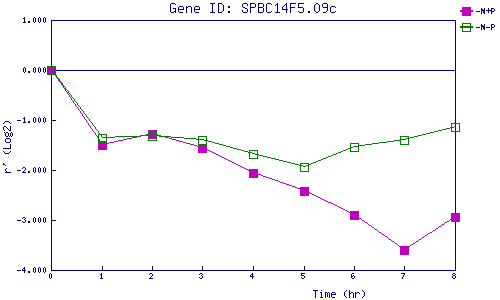
| 0 | 1 | 2 | 3 | 4 | 5 | 6 | 7 | 8 | |
| -N+P | 0.000 | -1.499 | -1.279 | -1.565 | -2.056 | -2.425 | -2.893 | -3.591 | -2.940 |
| -N-P | 0.000 | -1.354 | -1.315 | -1.399 | -1.678 | -1.936 | -1.544 | -1.395 | -1.143 |
|
-N+P: Nitrogen starved in the presence of P-factor -N-P: Nitrogen starved in the absence of P-factor |