cbh2
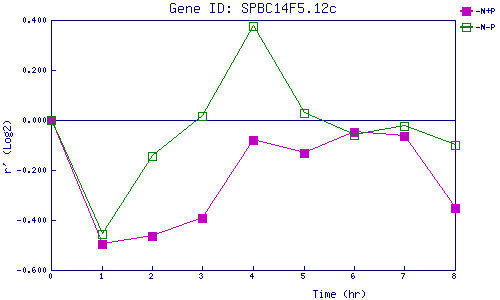
| 0 | 1 | 2 | 3 | 4 | 5 | 6 | 7 | 8 | |
| -N+P | 0.000 | -0.495 | -0.465 | -0.390 | -0.079 | -0.132 | -0.048 | -0.063 | -0.351 |
| -N-P | 0.000 | -0.457 | -0.142 | 0.014 | 0.374 | 0.027 | -0.061 | -0.024 | -0.100 |
|
-N+P: Nitrogen starved in the presence of P-factor -N-P: Nitrogen starved in the absence of P-factor |