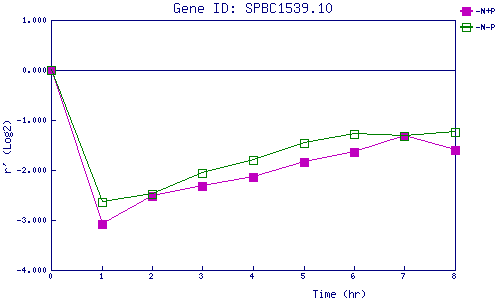
| 0 | 1 | 2 | 3 | 4 | 5 | 6 | 7 | 8 | |
| -N+P | 0.000 | -3.077 | -2.513 | -2.314 | -2.145 | -1.837 | -1.634 | -1.318 | -1.592 |
| -N-P | 0.000 | -2.650 | -2.472 | -2.062 | -1.798 | -1.466 | -1.289 | -1.314 | -1.240 |
|
-N+P: Nitrogen starved in the presence of P-factor -N-P: Nitrogen starved in the absence of P-factor |