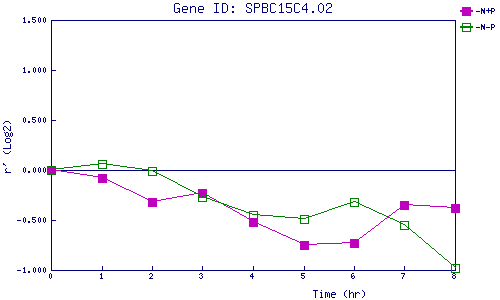
| 0 | 1 | 2 | 3 | 4 | 5 | 6 | 7 | 8 | |
| -N+P | 0.000 | -0.084 | -0.316 | -0.226 | -0.516 | -0.750 | -0.732 | -0.347 | -0.379 |
| -N-P | 0.000 | 0.057 | -0.014 | -0.269 | -0.449 | -0.488 | -0.318 | -0.546 | -0.980 |
|
-N+P: Nitrogen starved in the presence of P-factor -N-P: Nitrogen starved in the absence of P-factor |