| 0 | 1 | 2 | 3 | 4 | 5 | 6 | 7 | 8 | |
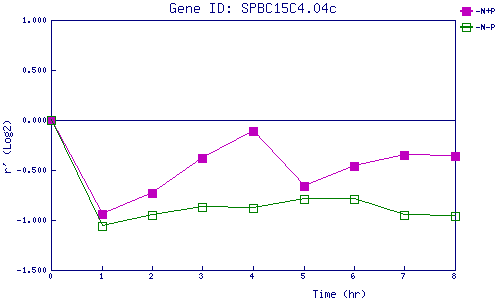
| -N+P | 0.000 | -0.936 | -0.727 | -0.382 | -0.114 | -0.662 | -0.464 | -0.350 | -0.361 |
| -N-P | 0.000 | -1.057 | -0.950 | -0.869 | -0.875 | -0.788 | -0.787 | -0.948 | -0.962 |
|
-N+P: Nitrogen starved in the presence of P-factor -N-P: Nitrogen starved in the absence of P-factor |