| 0 | 1 | 2 | 3 | 4 | 5 | 6 | 7 | 8 | |
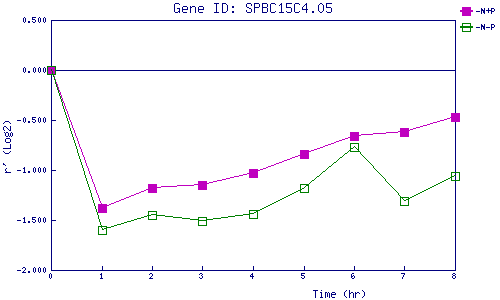
| -N+P | 0.000 | -1.381 | -1.184 | -1.148 | -1.028 | -0.843 | -0.658 | -0.622 | -0.469 |
| -N-P | 0.000 | -1.598 | -1.447 | -1.511 | -1.445 | -1.185 | -0.769 | -1.312 | -1.059 |
|
-N+P: Nitrogen starved in the presence of P-factor -N-P: Nitrogen starved in the absence of P-factor |