gpt gpt2
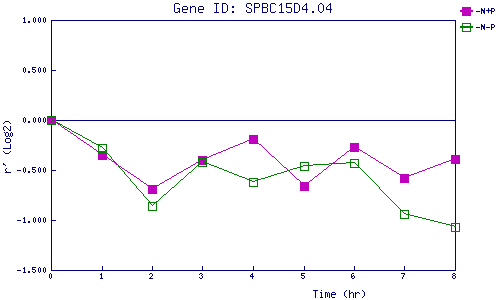
| 0 | 1 | 2 | 3 | 4 | 5 | 6 | 7 | 8 | |
| -N+P | 0.000 | -0.350 | -0.694 | -0.402 | -0.191 | -0.665 | -0.268 | -0.580 | -0.392 |
| -N-P | 0.000 | -0.283 | -0.863 | -0.420 | -0.622 | -0.461 | -0.427 | -0.944 | -1.068 |
|
-N+P: Nitrogen starved in the presence of P-factor -N-P: Nitrogen starved in the absence of P-factor |