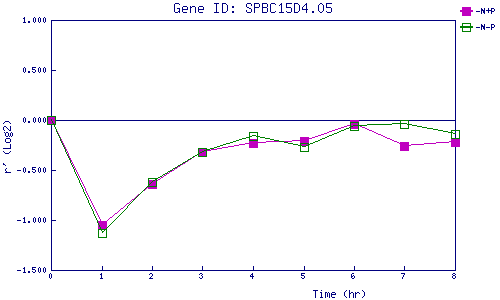
| 0 | 1 | 2 | 3 | 4 | 5 | 6 | 7 | 8 | |
| -N+P | 0.000 | -1.049 | -0.635 | -0.324 | -0.231 | -0.208 | -0.042 | -0.255 | -0.222 |
| -N-P | 0.000 | -1.126 | -0.622 | -0.315 | -0.159 | -0.267 | -0.063 | -0.040 | -0.145 |
|
-N+P: Nitrogen starved in the presence of P-factor -N-P: Nitrogen starved in the absence of P-factor |