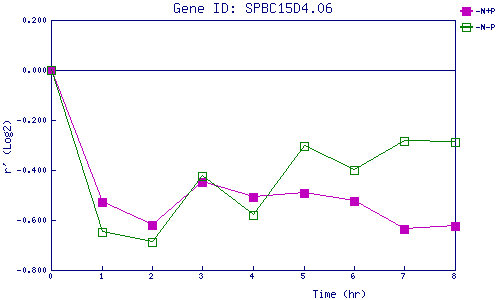
| 0 | 1 | 2 | 3 | 4 | 5 | 6 | 7 | 8 | |
| -N+P | 0.000 | -0.526 | -0.620 | -0.450 | -0.507 | -0.493 | -0.523 | -0.637 | -0.625 |
| -N-P | 0.000 | -0.646 | -0.688 | -0.426 | -0.581 | -0.302 | -0.399 | -0.284 | -0.289 |
|
-N+P: Nitrogen starved in the presence of P-factor -N-P: Nitrogen starved in the absence of P-factor |