taf73
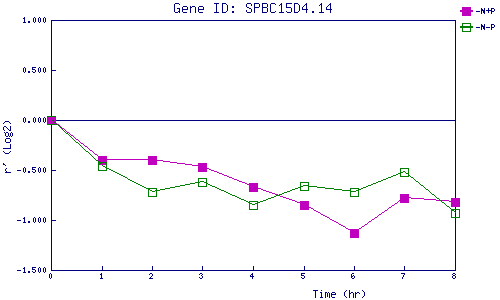
| 0 | 1 | 2 | 3 | 4 | 5 | 6 | 7 | 8 | |
| -N+P | 0.000 | -0.401 | -0.403 | -0.470 | -0.674 | -0.847 | -1.126 | -0.784 | -0.824 |
| -N-P | 0.000 | -0.460 | -0.721 | -0.621 | -0.851 | -0.660 | -0.715 | -0.520 | -0.931 |
|
-N+P: Nitrogen starved in the presence of P-factor -N-P: Nitrogen starved in the absence of P-factor |